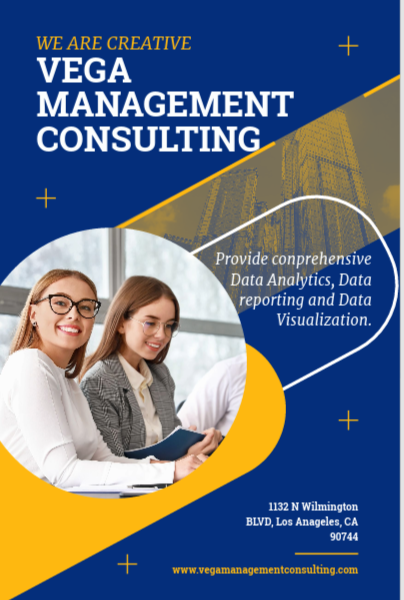
Unleashing Small Business Growth: The Power Trio of Data Analytics, Reporting, and Visualization
Introduction: In an age where data is the new currency, small businesses are presented with an unprecedented opportunity for accelerated growth. Data Analytics, Reporting, and Visualization have emerged as the triumphant trio, equipping small businesses with the tools needed to make informed decisions, optimize operations, and chart a course for rapid expansion. This article dives deep into how this power trio can catalyze small business success, transforming them into dynamic, competitive forces in their respective industries.
- Harnessing Data Analytics for Strategic Insights: Data Analytics serves as the foundation for fast-tracking small business growth. By delving into a wealth of data, businesses can uncover hidden patterns, trends, and correlations that might otherwise go unnoticed. This data-driven insight allows for strategic decision-making, empowering small businesses to identify their most profitable products or services, target the most promising customer segments, and allocate resources optimally for maximum returns.
- Empowering Data Reporting for Timely Action: The potency of data is only realized when it is effectively communicated. Data Reporting plays a pivotal role by transforming complex data into clear, actionable insights. Small businesses can now track their key performance indicators (KPIs) in real-time, enabling them to respond swiftly to emerging opportunities and challenges. Data Reporting ensures that decision-makers are equipped with the information they need to make impactful decisions promptly.
- Visualizing Success with Data Visualization: Numbers can often be overwhelming, but Data Visualization converts them into captivating visual stories. Graphs, charts, and interactive dashboards bring data to life, making it comprehensible even for those without a statistical background. Small business owners can use Data Visualization to monitor progress, identify trends at a glance, and communicate their successes to stakeholders, making the journey to growth engaging and inspiring.
- Customer-Centric Approach for Targeted Growth: Data Analytics, Reporting, and Visualization empower small businesses to adopt a customer-centric approach. By analyzing customer behavior and preferences, businesses can tailor their products, services, and marketing efforts to match their customers’ desires. This focused strategy not only cultivates customer loyalty but also drives word-of-mouth marketing, propelling growth through satisfied clients.
- Operational Efficiency for Sustainable Expansion: Small businesses often face resource limitations, making operational efficiency paramount. Data Analytics helps identify bottlenecks in processes, optimizing workflow and resource allocation. By integrating Data Reporting and Visualization, small businesses can monitor supply chain efficiency, streamline inventory management, and ensure every aspect of operations is aligned with growth goals.
- Agile Decision-Making in Dynamic Markets: In rapidly changing markets, adaptability is key. The power trio equips small businesses with the agility to pivot swiftly. Data Analytics identifies shifts in market trends, Data Reporting keeps decision-makers informed, and Data Visualization simplifies complex insights, allowing businesses to make well-informed decisions with confidence.
Conclusion: The synergy between Data Analytics, Reporting, and Visualization is a game-changer for small businesses seeking exponential growth. By integrating these three pillars into their strategies, small businesses can leverage data-driven insights to make informed decisions, improve operational efficiency, and seize opportunities swiftly. As the business landscape continues to evolve, the power trio will remain a steadfast ally, propelling small businesses forward, ensuring they not only survive but thrive in the dynamic world of commerce.
References:
- Data Analytics: Chen, H., Chiang, R. H., & Storey, V. C. (2012). Business Intelligence and Analytics: From Big Data to Big Impact. MIS Quarterly, 36(4), 1165-1188.
- Data Reporting: O’Leary, D. E. (2016). Enterprise reporting with Excel and SQL Server Reporting Services. Apress.
- Data Visualization: Few, S. (2019). Now you see it: Simple visualization techniques for quantitative analysis. Analytics Press.
- Customer-Centric Approach: Berthon, P., Pitt, L. F., Plangger, K., & Shapiro, D. (2012). Marketing meets Web 2.0, social media, and creative consumers: Implications for international marketing strategy. Business Horizons, 55(3), 261-271.
- Operational Efficiency: Davenport, T. H. (2013). Process Innovation: Reengineering Work through Information Technology. Harvard Business Press.
Verdieu St Fleur


